DistrictMatch
A dashboard to help Texas school district administrators identify similar school districts and benchmark their performance.
Plenty of outcome data, no way to compare school district performance
Public education data is available through platforms like the Texas Education Agency (TEA) website and the Texas Research Portal. Without dedicated data personnel, many districts struggle to transform raw data into actionable insights. This challenge limits their ability to evaluate demographic and performance trends.
Additionally, it is difficult to gauge how a district should be performing, since there are over 1,200 school districts in the state of Texas, each serving a demographically different student population. There is currently no standard tool or metric that allows districts to easily find others with similar demographic compositions, so districts can't benchmark their performance against comparable peers.
This lack of visibility prevents meaningful collaboration and limits opportunities to learn from districts that have implemented successful strategies in similar contexts.
Approach
If districts had a tool that could help them identify demographically comparable districts, a district could assess whether its peers are performing at a lower, similar, or higher level and use that information to seek out more effective strategies.
To tackle this problem, we first had to deal with the sheer quantity of data, determine a method for calculating "similarity" between districts that was easily interpretable, and finally present it in a way administrators could explore.
Automating the data download and cleanup
To address the first problem of wrangling raw data with inconsistencies into a clean dataset spanning multiple years, we built a Python web scraping application for the Texas Academic Performance Report (TAPR) Advanced Data Download Page. Each year has its own page with downloads for about 18 different datasets, covering topics ranging from demographics to academic outcomes. The scraping scripts were bundled into a user-friendly GUI application that downloads the datasets, deals with missing values, and renames columns to be human-readable. What used to take several minutes of clicking through download pages for each year of data now takes about a minute: select the years you want and wait.
Defining similarity
We considered various clustering algorithms, but decided on a simpler approach: a nearest neighbor search (NNS) to identify "neighbor districts" for user-selected districts. NNS was previously explored in Baltimore City Public Schools, where educators found it more transparent, fair, and interpretable than linear regression and K-Means.
To ensure comparability across features, we standardized all columns used in the feature sets. Then, we analyzed different distance metrics, both quantitatively and qualitatively.
We computed the average variance across the selected features within each neighbor group, using this as a proxy for how "tight" or internally similar each group was. Using Houston ISD as the "home" district, we compared variances for Euclidean, Manhattan, and Mahalanobis distances. We found that Euclidean distance yielded the lowest variance, or the most "similar" neighbors.
We also conducted a blind test with officials from Aldine ISD, Houston ISD, Pasadena ISD, Spring ISD, and Spring Branch ISD. We showed each district three sets of neighbors, one per distance metric, along with visualizations of the demographic similarities between their district and its "neighbors", and asked which set they found most useful. A majority of the officials felt that Euclidean distance produced the best set of "neighbor" districts.
The search was run only on demographic data so that district administrators can compare outcomes with districts that serve demographically similar student populations but might be doing a better job supporting those students.
The dashboard
From the dashboard's sidebar, users pick a "home" district in Texas, the demographic features to match on (such as student count and the percentage of economically disadvantaged students), the number of neighbor districts, and the year of data.
The "Run Model" button calculates the nearest neighbors to the "home" district, using only the demographic features chosen by the user. The model returns a map and a table of the matched districts.
The "Why these districts?" page charts how each match compares to the home district on the selected features, showing why each district was selected.
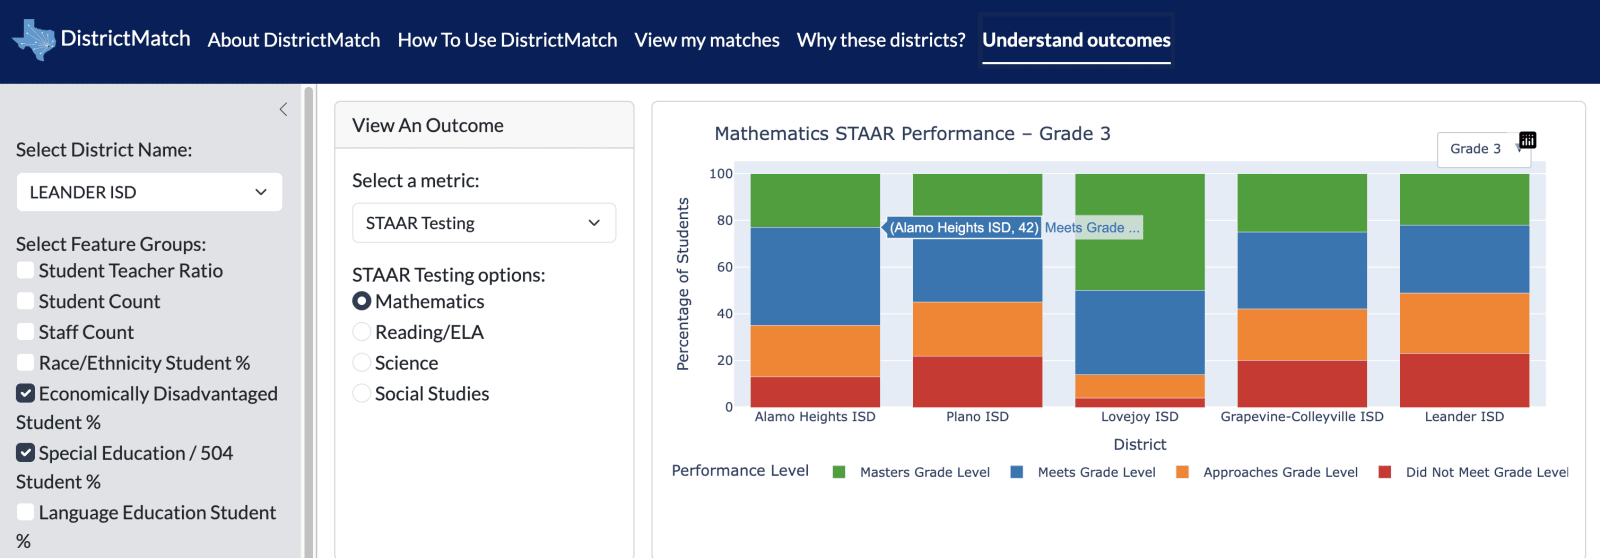
The final page is "Understand outcomes", which shows outcome-related data as visualizations for districts to compare with each other. For example, looking at 3rd-grade STAAR math results, an administrator from Leander ISD might notice that they have fewer students at "Masters Grade Level" than Lovejoy ISD. Leander could then work with Lovejoy to understand that difference and change their policies to better serve their own students.
My role
I used the Python packages Selenium and BeautifulSoup4 to build the scraper logic, then packaged it with PyInstaller into a shareable .exe file that could be used by non-technical staff at the Houston Education Research Consortium (HERC).
I looked into different dashboard solutions and determined Shiny for Python would be the best way to integrate visualizations with our nearest neighbor search code. I built the interface, designed the logo and branding, and created the map and many of the outcome visualizations.
Results
The director of HERC was impressed by the scraper and excited to share it with her staff to make working with Texas Education Agency data easier. A previous student team had built a dashboard for the same initiative, but the sheer number of visualizations and the lack of guidance made it difficult for non-technical users to understand. The director felt that our dashboard made exploring the data simpler and clearly explained how to use it.
Learn more about the project through this short video.