In the 2018 Texas Senate election, Democratic candidate Beto O'Rourke came close to flipping a seat blue in the closest US Senate race in Texas since 1978. However, Republican incumbent Ted Cruz managed to remain in office by a mere 214,921 votes.
Since then, Democrats have failed to gain momentum towards flipping a statewide office in their favor, with Republican incumbents John Cornyn in 2020 and Ted Cruz in 2024 winning re-election by comfortable margins.
This year as early voting begins, late October polls have Democratic candidate James Talarico polling either slightly ahead of or tied with Republican nominee and current Texas Attorney General Ken Paxton.
In contrast, O'Rourke, Texas Democrats' best hope to date, led in very few polls in the 2018 election cycle. Experts believe that this race is gearing up to be a different race than any before it, but do the polls suggest Talarico will perform better than O'Rourke on the ballot?
The most recent Fox News poll has the candidates tied at 49%. Emerson, on the other hand, has the candidates close, but Talarico "inching up" to a two-point advantage.
To see where other polls land, I looked at the Texas Politics Project polls in June and October 2026. To compare this year's polls with the 2018 election polls, I also looked at the Project's polls from the same months in 2018.
Comparing June and October 2026 polls, the Texas Politics Project found little movement in vote choice, putting the candidates within half a percentage point of one another. Looking at just likely voters, with undecideds asked which way they lean, however, TPP measured a 3-point lead for Talarico.
In Texas Politics Project 2018 polls, Cruz led O'Rourke in both June and October polls. Support for both candidates increased between the two polls, as more undecided respondents made their selections. However, this did not change the gap between Cruz and O'Rourke.
Fewer undecided voters early on
In June 2018, nearly 1 in 5 voters were undecided on their vote choice. By October 2018, less than 1 in 10 voters were undecided. In 2026, June polls showed 9.8% of voters undecided, about half the June 2018 level. In October 2026, the percentage of undecided voters has risen to 11.8%, meaning that more voters are undecided close to the election than in 2018.
The political identification of undecided voters in October 2018 and 2026 (88 and 108 respondents, respectively) shows a drop in undecided Democrats. In 2018, 35% of undecided respondents were Democrats. In 2026, it's 14%. Independents are 47%, an increase from 36% in 2018, and Republicans are 18%, up from 13%. These subgroups have a wide margin of error due to sample size, but the decline in undecided Democrats aligns with findings that Democrats have stronger party loyalty than Republicans in this race. According to the most recent Fox News poll, 90% of Republicans support Paxton, compared to 98% of Democrats supporting Talarico.
These voters' opinions of the two candidates provide little insight into which way they might swing. For both candidates, over half of respondents said they didn't know what their opinion about the candidate was, or that they had a neutral opinion.
There was a slight difference between unfavorable opinions about the two candidates. Over one fourth of undecided voters said they felt either somewhat or very unfavorably about Paxton, whereas less than one fifth felt somewhat or very unfavorably about Talarico.
Does Talarico have a shot?
In 2018, Beto O'Rourke trailed Ted Cruz throughout polls leading up to the election. This year, Talarico and Paxton are neck and neck.
If the polls are a good indication, this race will be close. With over 1 in 10 respondents initially saying they did not know who they would vote for a month out from the election, these undecided voters have the potential to change the tide of the election. Which way the tide turns will depend on independents choosing a side and whether the undecided Republicans cross party lines to support Talarico or stick with the Republican Party.
Notes
The Texas Politics Project surveys registered voters and also reports likely-voter results.
My analysis uses all registered voters, weighted, and the initial question about voting (they did not run a "forced" response for all four polls reviewed, so I refrained from using it for the ones that do have it), so figures differ from the Project’s published results.
Fox and Emerson report likely voters.
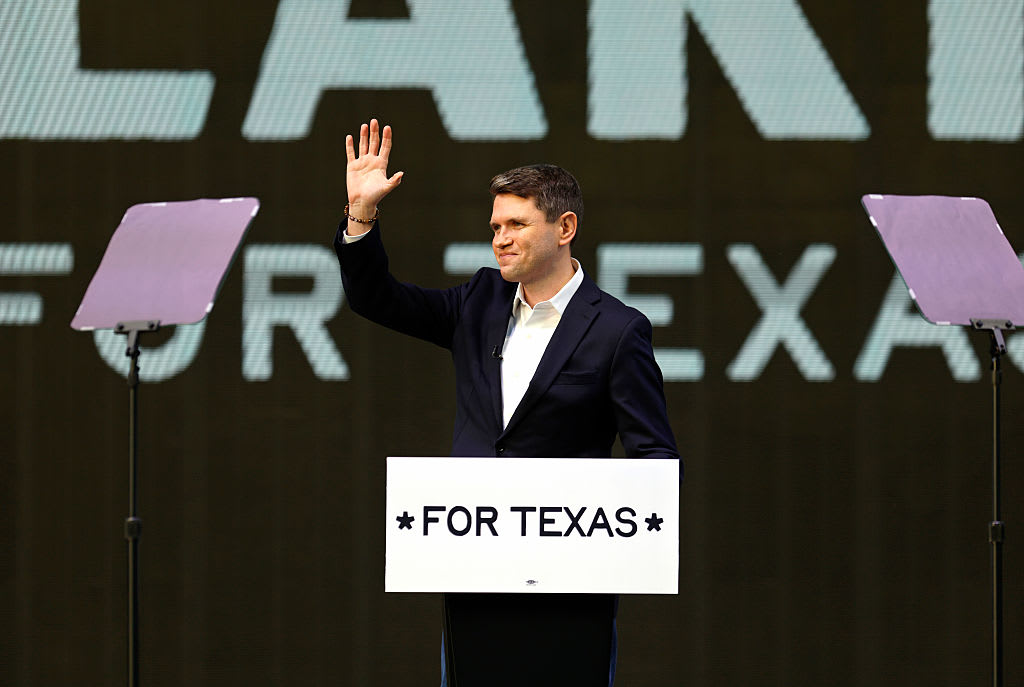
Hero photo: Ron Jenkins/Getty Images